Part 4
Inductor Simulator & Graphic EQ Circuit
CIRCUIT
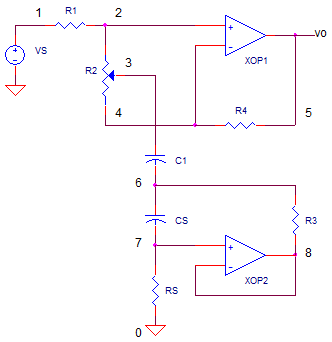
OP_L_SIM_BANDCUT_BOOST.CIR Download the SPICE file
This topic continues a four part series in the design of a graphic equalizer circuit.
1. Band Cut and Boost - Series LCR
2. Cut/Boost - Single Pot
3. Band Cut/Boost - Series LCR and Pot
4. Simulated Inductor
Part 4 of the Graphic Equalizer Series uncovers how you can simulate an series RL circuit using an RC series circuit and an op amp! Why bother? Inductors designed for the audio range become far too big and expensive for compact audio equipment such as a guitar effect foot pedal.
We'll take an an intuitive look by observing the currents and voltages through simple RL and RC circuits. The op amp transforms one into the other. Finally, we'll take the EQ filter created in Part 3 and replace the inductor with our simulated one.
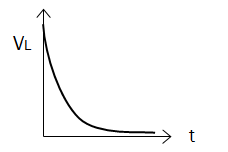
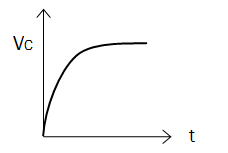
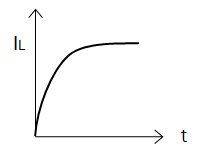
RL AND RC WAVEFORMS
One simulation approach examines the waveforms of both the RL and the
RC circuit. Specifically, what about the waveforms of the RC could be
exploited to mimic the RL behavior? Let's look over the response of an RL
and RC to step input vs. The set of V and I waveforms look something like this.
|
|
|
|
 |
 |
|
 |
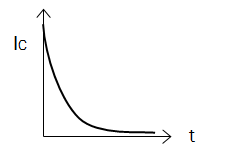 |
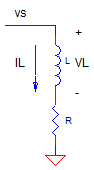
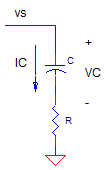
The goal of our RL simulator is to create an impedance to ground such that the current waveform looks like the RL current waveform.
RL SIMULATOR
Although the RC's current is very different from RL's current, the
voltage across C appears identical to the RL current! What if we could take
the voltage across the capacitor and create a current draw from it? The simple
circuit below accomplishes this feat.
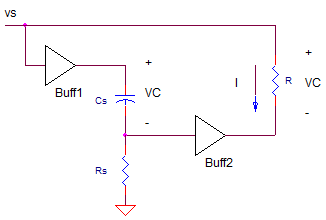
The buffers B1 and B2 essentially transfer the capacitor voltage to a resistor R. The upshot being a current created through the R leg that looks a lot like the capacitor voltage, and in turn - as we observed before - looks like the current through an RL circuit! Buff1 also prevents Cs, Rs from drawing the current from node vs, upsetting the intended behavior.
How do we design this simulator? To get the same wave shape versus time for R, L leg, we choose the Rs, Cs leg to have the same time constant as the RL circuit: L / R = Rs * Cs. So choosing Cs, you solve for Rs to get
Rs = L / (R * Cs)
To get the same current draw simply set R to the resistance of the RL leg. For example, to simulate a R = 1100 and L = 0.33H, choose Cs=1nF and calculate
Rs = 0.33 / (1100 * 1nF)
= 300kR = 1100
GRAPHIC EQ CIRCUIT
Finally, after a long journey we are able to assemble the pieces of
graphic EQ together. We take the band cut/boost circuit from Part 3 and
replace the RL leg with our simulated RL!
The XOP2 devices acts as the Buff2 in the simplified diagram above. But wait - what happened to Buff1. To save components (space and money), a simple trick makes Buff1 unnecessary. By choosing CS and RS to have large impedances, the current flow in these components becomes negligible compared to R3. No buffer needed.
SPICE TEST
Let's simulate an EQ circuit designed for K=±10x
@ 800 Hz. Set RPOS Fully Counter
Clockwise (RPOS=1) for max attenuation. Run the file OP_L_SIM_BANDCUT_BOOST.CIR to
perform an AC Analysis on the circuit.
CIRCUIT INSIGHT Check the frequency response by plotting the input V(1) and output V(5). Does the output show gain or attenuation? Does it cut the signal at about 10x (or -20dB)? Is the attenuation wideband or narrowband? What is the center frequency?
Now, set RPOS Fully Clockwise (RPOS=99) for max boost and rerun the simulation. Does it hit the design target of a boost around 10x (or +20dB)?
Finally, set RPOS to the center position (RPOS=50) and rerun the
simulation. What do you think the response will be with the pot set dead
center between cut and boost positions?
FULL GRAPHIC EQ
Now that we've got an EQ circuit centered at 800Hz, how do you add -
say 5 other bands - to create a six-band Graphic EQ? The cool thing is you
don't have to duplicate the entire circuit! You'll need the following
Just one amplifier XOP1 and its gain resistors R1 and R4.
Then duplicate the pot plus LCR leg for each EQ band. Calculate new LCR values for each center frequency.
Lastly, all of the pots for each band are connected across the XOP1's + and - input terminals. How does this work? All of the band cut/boost filters work simultaneously, the op amp summing the action of each one.
SPICE FILE
Download the file or copy this netlist into a text file with the *.cir extention.
* op_bandcut_boost_L_sim.cir
*
VS	1	0	AC	1	SIN(0V 1V 800Hz)
*
* POTENTIOMETER POSITION (1=CCW, 50=MID, 99=CW)
.PARAM RPOS=1
*
R1	1	2	10K
R2A	2	3	{ RPOS/100*20K }
R2B	3	4	{ (1-RPOS/100)*20K }
R4	4	5	10k
* OPAMP
XOP1	2 4	5	OPAMP1
*
C1	3	6	120NF
*
* SIMULATED LR
CS	6	7	1NF
RS	7	0	300K
R3	6	8	1100
XOP2 7	8	8	OPAMP1
*
* OPAMP MACRO MODEL, SINGLE-POLE
* connections:      non-inverting input
*                   |   inverting input
*                   |   |   output
*                   |   |   |
.SUBCKT OPAMP1	    1   2   6
* INPUT IMPEDANCE
RIN	1	2	10MEG
* GAIN BW PRODUCT = 1MHZ
* DC GAIN (100K) AND POLE 1 (10HZ)
EGAIN	3 0	1 2	100K
RP1	3	4	1K
CP1	4	0	15.915UF
* OUTPUT BUFFER AND RESISTANCE
EBUFFER	5 0	4 0	1
ROUT	5	6	10
.ENDS
*
* ANALYSIS *************************************
*.TRAN 	1us  100us
.ac dec 40 10 100k
.PROBE
.END
© 2011 eCircuit Center